Wyoming wind capacity factors, 2001 to 2025
Dataset as of 16 November 2026. Covers every wind plant in Wyoming reported to EIA, using final data through 2025.
A wind farm's capacity factor is the electricity it generated in a period divided by what it would have generated running at full nameplate capacity for the whole period. It measures how much of the time, in effect, the turbines were producing at full output, and it depends on the wind, on the turbines, and on how often they were stopped for maintenance or because the grid could not take their power.
The fleet in 2025
Wyoming had 28 wind plants with 4,707.4 MW of capacity at the end of 2025, which generated 12.73 TWh. The 25 plants that operated all year at unchanged capacity, 79% of the capacity, had a combined capacity factor of 35.3%. Plants that entered service in 2020 or later (11 plants) reached 38.1% together, against 30.5% for the 13 plants that entered service in 2010 or earlier.
| Plant | County | In service since | Capacity (MW) | 2025 net generation (GWh) | Capacity factor | Not counted because | EIA plant ID |
|---|---|---|---|---|---|---|---|
| Foote Creek Rim | Carbon | 2024 | 134.8 | 636 | 53.9% | 67916 | |
| Corriedale Wind Energy | Laramie | 2020 | 52.5 | 214 | 46.6% | 63436 | |
| Roundhouse Wind Energy Project | Laramie | 2020 | 226.0 | 826 | 41.7% | 63133 | |
| Boswell Wind | Albany | 2024 | 329.8 | 1,185 | 41.0% | 65403 | |
| Cedar Springs III | Converse | 2020 | 133.0 | 475 | 40.8% | 63916 | |
| Roundhouse Renewable Energy II | Laramie | 2023 | 105.7 | 376 | 40.6% | 67026 | |
| Cedar Springs I | Converse | 2020 | 200.0 | 700 | 39.9% | 63914 | |
| Cedar Springs II | Converse | 2020 | 200.0 | 652 | 37.2% | 63915 | |
| Dunlap | Carbon | 2010 | 129.5 | 417 | 36.7% | 57299 | |
| Pioneer Wind Park, LLC | Converse | 2016 | 80.0 | 253 | 36.0% | 60259 | |
| Seven Mile Hill | Carbon | 2008 | 146.2 | 458 | 35.8% | 56843 | |
| Anticline Wind | Natrona | 2024 | 124.3 | 387 | 35.5% | 67193 | |
| McFadden Ridge | Albany | 2009 | 35.2 | 105 | 34.0% | 57039 | |
| Ekola Flats | Carbon | 2020 | 250.9 | 736 | 33.5% | 62591 | |
| Glenrock | Converse | 2008 | 165.6 | 469 | 32.4% | 56841 | |
| High Plains | Albany | 2009 | 122.1 | 341 | 31.9% | 57040 | |
| TB Flats | Carbon | 2021 | 503.2 | 1,362 | 30.9% | 62516 | |
| Campbell Hill Windpower | Converse | 2009 | 99.0 | 254 | 29.2% | 57090 | |
| Rolling Hills | Converse | 2009 | 115.8 | 295 | 29.1% | 56842 | |
| Mountain Wind Power LLC | Uinta | 2008 | 61.0 | 151 | 28.3% | 56752 | |
| Top of the World Windpower Project | Converse | 2010 | 200.0 | 496 | 28.3% | 57327 | |
| Silver Sage Windpower | Laramie | 2009 | 42.0 | 100 | 27.3% | 57091 | |
| Mountain Wind Power II LLC | Uinta | 2008 | 80.0 | 188 | 26.8% | 56753 | |
| TransAlta Wyoming Wind | Uinta | 2003 | 144.0 | 321 | 25.5% | 56093 | |
| Happy Jack Windpower Project | Laramie | 2008 | 29.4 | 59 | 22.8% | 56960 | |
| Casper Wind Farm | Natrona | 2009 | 17.0 | 0 | No net generation reported | 57093 | |
| Cedar Springs Wind IV | Converse | 2025 | 390.4 | 1,056 | Generator entered service during year | 67289 | |
| Rock Creek Wind | Carbon | 2025 | 590.0 | 212 | Generator entered service during year | 67769 |
Capacity is the nameplate capacity of the plant's wind generators at the end of 2025. Generation is net generation, after the plant's own use.
Year by year
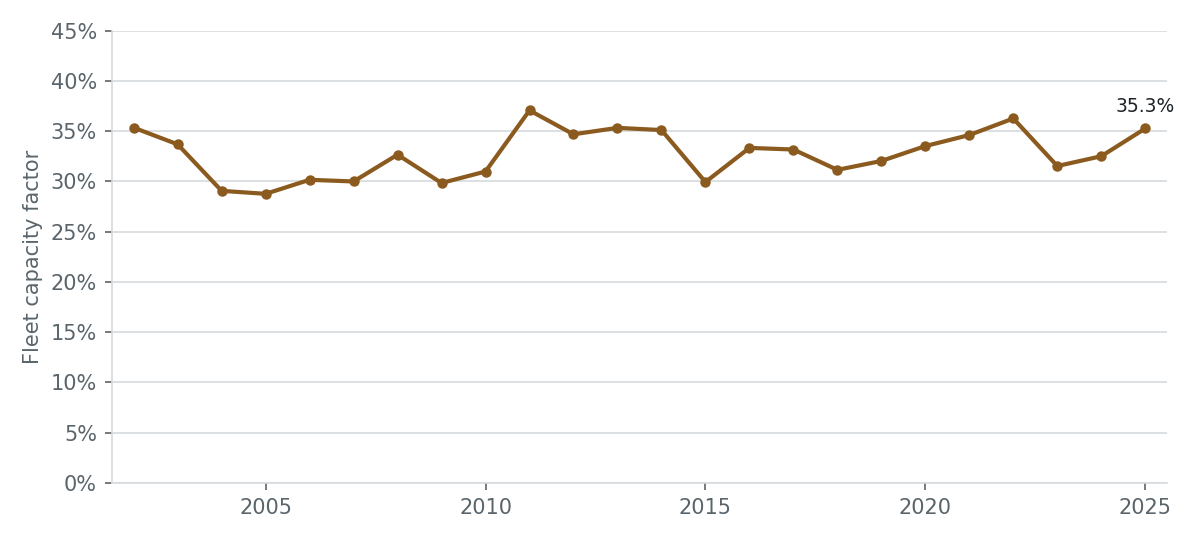
Since 2002, the fleet capacity factor has ranged from 28.8% (2005) to 37.1% (2011). Year-to-year changes mostly reflect the wind itself and the changing mix of plants, so a single year says little about any one plant.
| Year | Fleet capacity factor | Plants counted | Share of wind capacity counted | All wind generation (TWh) |
|---|---|---|---|---|
| 2025 | 35.3% | 25 of 28 | 79% | 12.73 |
| 2024 | 32.5% | 22 of 26 | 84% | 9.00 |
| 2023 | 31.5% | 23 of 28 | 94% | 8.63 |
| 2022 | 36.2% | 24 of 25 | 98% | 9.78 |
| 2021 | 34.6% | 23 of 25 | 80% | 8.45 |
| 2020 | 33.5% | 18 of 24 | 59% | 5.51 |
| 2019 | 32.0% | 15 of 21 | 63% | 4.16 |
| 2018 | 31.1% | 21 of 21 | 100% | 4.06 |
| 2017 | 33.2% | 21 of 21 | 100% | 4.32 |
| 2016 | 33.3% | 14 of 21 | 55% | 4.39 |
| 2015 | 29.9% | 20 of 20 | 100% | 3.76 |
| 2014 | 35.1% | 20 of 20 | 100% | 4.41 |
| 2013 | 35.3% | 20 of 20 | 100% | 4.43 |
| 2012 | 34.7% | 19 of 20 | 98% | 4.37 |
| 2011 | 37.1% | 14 of 20 | 66% | 4.61 |
| 2010 | 31.0% | 18 of 20 | 78% | 3.25 |
| 2009 | 29.8% | 11 of 18 | 53% | 2.23 |
| 2008 | 32.6% | 7 of 12 | 42% | 0.96 |
| 2007 | 30.0% | 7 of 7 | 100% | 0.75 |
| 2006 | 30.1% | 7 of 7 | 100% | 0.76 |
| 2005 | 28.8% | 6 of 7 | 97% | 0.72 |
| 2004 | 29.1% | 4 of 7 | 85% | 0.62 |
| 2003 | 33.7% | 5 of 7 | 44% | 0.37 |
| 2002 | 35.3% | 6 of 6 | 100% | 0.44 |
Month by month
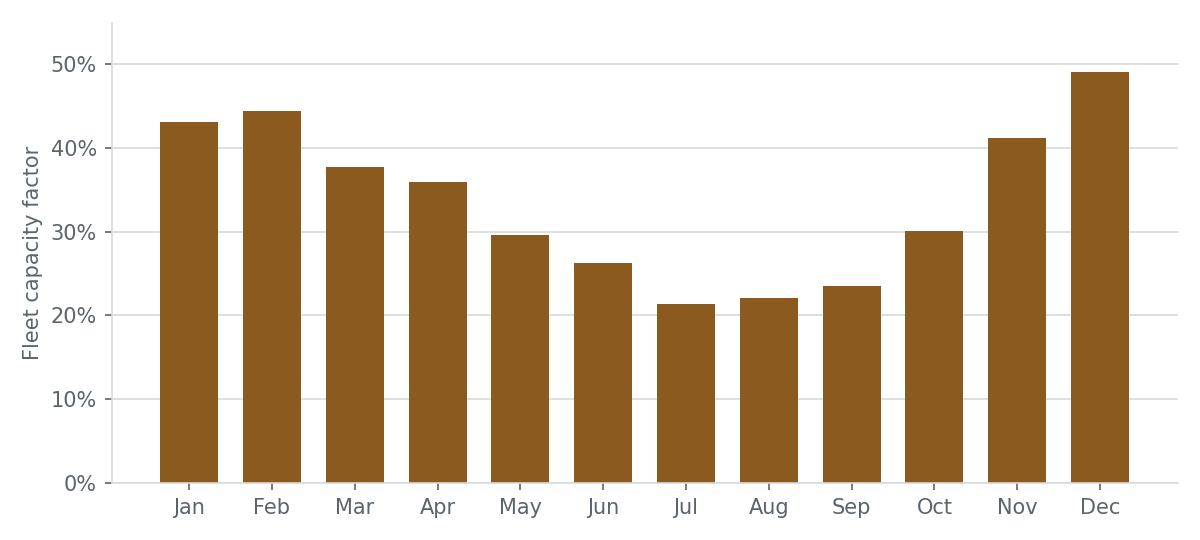
Wyoming's wind farms generate most in winter. Over 2016 to 2025, the fleet's capacity factor was highest in December (49.0%) and lowest in July (21.4%).
Which plant-years are counted
A plant-year is counted only if every wind generator at the plant ran for the whole year at the same nameplate capacity as the year before. A plant's first year is partial, and a year in which turbines were added, retired or replaced would divide a year's generation by the wrong capacity, so those years are kept in the data with the reason but given no capacity factor. Of 437 plant-years from 2001 to 2025, 370 are counted; the rest are 31 generator entered service during year, 19 capacity changed during year, 7 no net generation reported, 5 no capacity record for the previous year, 5 generator retired during year. 2001 itself has no capacity factor because the data begin that year, so no plant has a record for the year before. Fleet figures are the total generation of the counted plants divided by their total possible generation, so large plants weigh more than small ones.
Checks
- Every Wyoming wind plant's 2025 net generation, for the year and for each month, matches EIA's own EIA-923 workbook to the megawatt-hour (27 plants, 12.73 TWh).
- For every plant-year, the monthly generation adds up to the annual figure (largest difference 0 MWh).
- For the 335 counted plant-years since 2008, PUDL's generator-level generation agrees with the plant-level figure (largest relative difference 0).
- Capacity and generation for 2025 agree with the 2025 generation dataset.
Notes and limitations
- A low capacity factor is not by itself a sign of a poor site or poor turbines. EIA-923 does not report curtailment, outages or the wind resource, so this data cannot separate them.
- Nameplate capacity is as reported to EIA-860. A plant repowered with new turbines at unchanged nameplate capacity cannot be detected from these forms, so the year of the work may be counted.
- 4 plants (Casper Wind Farm, Foote Creek II, Foote Creek III, Foote Creek IV) reported no wind generation in 7 plant-years while still listed as existing; those years are not counted.
Downloads
- wyoming_wind_plant_years.csv: one row for each plant and year, with location, operator, capacity, net generation, whether the year is counted and why not, and the capacity factor.
- wyoming_wind_plant_months.csv: one row for each plant and month of every counted plant-year.
- wyoming_wind_fleet.csv: the fleet figures above, by year and by calendar month.
- wind_checks.json: the checks recorded when the data was built.
Sources and reproduction
Built from the PUDL tables out_eia__yearly_generators (EIA Form 860),
out_eia923__yearly_generation_fuel_combined and out_eia923__monthly_generation_fuel_combined
(EIA Form 923), and checked against EIA's EIA-923 workbook for 2025. Run
python scripts/build_wind_capacity_factors.py --eia923 path/to/EIA923_Schedules_2_3_4_5_M_12_2025_Final.xlsx
and python scripts/plot_wind.py from the repository. Please cite as: High Plains
Open Energy Data (2026), Wyoming wind capacity factors, 2001 to 2025, derived from the
Public Utility Data Liberation project (Catalyst Cooperative) and U.S. EIA Forms 860 and 923.